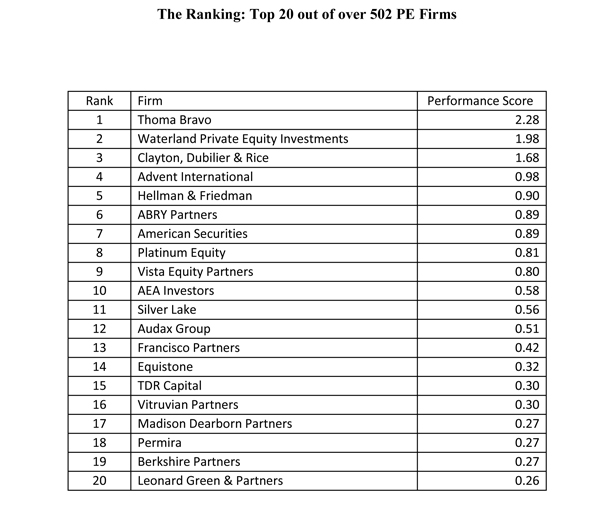
The 2018 HEC-DowJones Private Equity Performance Ranking lists the world’s Top PE firms in terms of aggregate performance based on all buyout funds raised between 2005 and 2014. This ranking answers the question: “Which firm(s) generated the best performance for their investors over the past years?” The ranking draws on a comprehensive set of data on PE fund performance provided by preqin and directly from PE Firms and uses a unique methodology to calculate the aggregate performance of a PE firm based on difference performance measures for all the funds managed by this firm. The method is able to aggregate performance across vintage years and considers relative and absolute returns. In total, we analyzed performance data from 502 PE firms and the 898 funds they raised between 2005 and 2014 with an aggregate equity volume of $1.293bn.
The Ranking: Top 20 out of over 502 PE Firms
Introduction
The Private Equity industry is notorious for being opaque and access to any data is chronically difficult. In particular, little is known about the performance and competitive behaviour of the key PE Firms. While performance rankings exists for many other areas (the best ‘business school’, the best ‘place to work’, the best ‘stock market analyst’ etc), nothing worth that name exists in PE. Until recently, the only available rankings for Private Equity were based on size alone, which has very limited meaning. Since 2009, HEC Paris and DowJones have joined forces to publish regular rankings of PE Firms based on their historic performance and expected future competitiveness respectively.
Simply Speaking, what does the performance ranking mean?
This ranking answers the question: “Which firm(s) generated the best performance for their investors over the past years?” It draws on performance information from all buyout funds managed by a given PE Firm and aggregates their performance based on a novel and proprietary methodology (see below) into one overall performance score.
What are the data sources behind the rankings?
To obtain a most accurate picture of the universe of PE Firms and their investments, we drew on a variety of available databases and performed a number of cross-checks of the information used in this study. We used the preqin PE fund performance database as the primary database for fund performance information, in addition to an increasing amount of information directly provided by PE Firms to HEC for the purpose of these rankings.
While HEC has access to additional proprietary information on the activity and performance of PE Firms (HEC Buyout Database), this data is anonymous and cannot be used for this study.
How have the evaluated PE Firms been selected?
We gathered data, as of November 2018, on the universe of PE firms worldwide on which preqin provides performance data or which provided data directly to HEC for the purpose of the performance rankings. This results in a sample of 502PE firms and the 898 funds they raised between 2005 and 2014 with an aggregate equity volume of $1.293bn. From this starting sample, we selected all those PE firms that met the following objective criteria:
• At least 2 funds which raised over the 2005 to 2014 period for which full performance information is available;
• Performance data available on at least 85% of the funds (in terms of fund size)
• At least $2500m raised during this time;
• Investments in US, EU or global
• At least 10 observation years (i.e. the sum of the 'age' of all funds as of today);
Why these selection criteria?
It is our intention to limit the analysis to PE Firms that are of relevant scale in terms of their activities. (i.e. minimum capital under management). Also, we want to make sure that we exclude GPs who only disclose returns of their best performing funds and that we do not report any ‘one-hit-wonders’, hence the requirement to have at least 2 funds with full performance information and 10 ‘observation years’. We also exclude pure “emerging market” PE firms. We do not consider funds raised after 2015, as their performance is still too unreliable to be judged at this point.
How large and representative is your sample of PE Firms?
The 134 firms that passed the criteria raised 369 funds between 2005 and 2014 with total equity of over $1019bn. This corresponds to over 3/4 of the starting sample in terms of equity.
How has the aggregate past performance been assessed?
Private Equity is an asset class that makes it particularly challenging to assess the aggregate performance of a given PE Firm. Performance is typically recorded at the fund-level (and not for the entire PE Firm). Furthermore, three factors make the aggregation of performance to the firm-level challenging:
1. Alternative, complementary performance measures are used to assess performance (e.g. IRR vs. Return Multiple), so that it is not trivial to know what measure to look at.
2. People disagree whether firms should be assessed according to their absolute performance or based on the performance relative to a performance benchmark.
3. Private Equity Firms typically manage a number of limited-life funds raised at different vintage years simultaneously and the so-called J-Curve phenomenon makes it difficult to say, whether a 4-year-old fund with a 15% IRR is better or worse than a 7-year-old fund with a 20% IRR.
In a project sponsored by advisory firm PERACS GmbH, Prof. Oliver Gottschalg from HEC School of Management, has developed a proprietary methodology that makes it possible to comprehensively assess the aggregate performance of all funds managed by a Private Equity Firm. The basis for this assessment is the performance of each fund, measured in terms of three complementary performance measures: IRR, DPI (cash-only return multiple) and TVPI (a return multiple that considers accounting values of ongoing investments). We assess performance in each measure both as absolute values and measured against the corresponding performance benchmark, leading to 2*3=6 performance indicators.
These six indicators are then combined for multiple funds based on a proprietary statistical method that considers the empirically-derived historical reliability of performance measured at a given ‘fund age’ as weights. The intuition for this method is as follows: We determined empirically the reliability of performance of funds that are 2, 3, 4… years old. Our sample included detailed data on the evolution of the performance of 492 actual buyout funds over time. Imagine, the performance of a 3-year-old fund predicts its final performance with 35% accuracy, while the performance of a 5-year-old fund predicts its final performance with 70% accuracy. We would then give twice as much weight to performance data of 5-year-old funds than to the performance data of 3-year-old funds in the aggregation. Finally, we combine all six performance measures to a single performance score using a standard statistical method called ‘Principal Component Analysis’. This makes it possible to compare the overall value creation ability of Private Equity Firms across all their funds.
How to Interpret the ‘Aggregate Performance Score’?
The aggregate performance score is neither an IRR-type annual return measure nor a money multiple. It can only be interpreted relative to the average aggregate performance score of all firms we analyzed: An aggregate performance score of 1 means that a given PE Firm has an aggregate performance that is one ‘standard deviation’ above the average performance, which would position it typically at the 85% percentile, i.e. 85% of all firms would have a lower aggregate performance. Also, an aggregate performance score of 2 means that performance is twice as high as for an aggregate performance score of 1. A PE Firm with the average performance has (by design) an aggregate performance score of 0.
How sensitive are the results to the valuation of unrealized investments?
The valuation of unrealized investments has only a small impact on the rankings. First, we only consider funds that are at least four years old. Second, according to our methodology, young (with relatively more unrealized investments) funds carry less weight in the performance aggregation than older funds, as we consider that the performance of younger funds is inherently less precise. Finally, two of our six individual performance measures (DPI) consider cash-on-cash performance only and ignores valuations of unrealized investments.
What does the ranking not capture?
The Performance Ranking is backward-looking by definition. It cannot capture recent changes in the strategy, the core team or the fund/deal size of a PE Firm. As such, it may not capture all elements of the current competitiveness of a given PE Firm.
LIMITATIONS
The confidential nature of the PE industry makes it impossible to compose a 100% accurate database on private equity and we cannot exclude the possibility of biases in our results due to missing or inaccurate information. However, we rely on the same data sources typically used to compose industry-standard statistics of PE activity and we consider our data by far the ‘best available’ for this kind of analysis.
***
IMPORTANT DISCLAIMER
This material has been prepared on the basis of publicly available information, internally
developed data and other third party sources believed to be reliable, however, HEC Paris and Peracs, GmbH have not sought to independently verify information obtained from these sources and makes no representations or warranties as to accuracy, completeness or reliability of such information. This material is for information and illustrative purposes only, is not investment advice and is no assurance of actual future performance or results of any private equity segment or fund. HEC and Peracs do not represent, warrant or guarantee that this information is suitable for any investment purpose and it should not be used as a basis for investment decisions. Nothing
herein should be construed as any past, current or future recommendation to buy or sell any security or an offer to sell, a solicitation of an offer to buy any security. This material does not purport to contain all of the information that a prospective investor may wish to consider and is not to be relied upon as such or used in substitution for the exercise of independent judgment.
More about the Private Equity Observatory - Buyout Center