

Dare HEC Media Hub

How Boardroom Diplomacy Could Reshape Peace in Middle East
As private-sector figures enter peace negotiations, future business leaders need sharper geopolitical judgment about mod…
As private-sector figures enter peace negotiations, future business leaders need sharper geopolitical judgment about modern conflicts to interpret these developments for responsibl…
Insights You Need

Automation, data monetization, and high-frequency trading are transforming finance and challenging regulators.

Tracking 300+ B2B high-tech startups reveals when personal selling and mass-media marketing drive performance, and when they backfire.
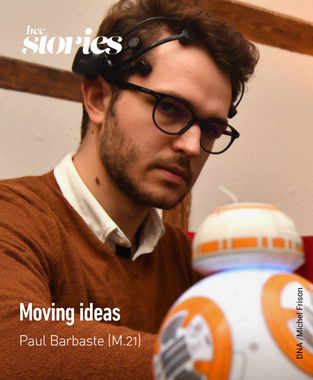
Some encounters change destinies. Keep your mind open.
Inspiring voices


Stories


HEC Startups


Think sharper. Grasp what matters. Solve better.
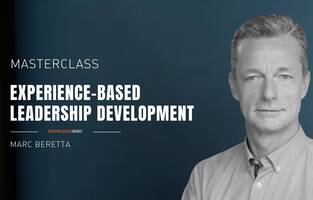
Reskill Masterclass


Knowledge


Decoding


Enough talk. Join the doers. Make change happen.
Students POV


HEC Startups

Business & Geopolitics: Operating in a Fragmented World
Geopolitics is reshaping power balance and markets in Europe and worldwide. HEC Paris's clear position is to integrate this knowledge into business strategies.


What Debt Teaches Us About Human Exchange
The Selection By
Brian Hill is Research Director at the French National Centre for Scientific Research (CNRS) and Professor in Economics and Decision Science…


For curious minds seeking research-based insights and inspiring stories that help make sense of a world in transition, and unlock solutions within a purpose-driven community.